Great
Explainers
Making complex Financial subjects
Easy to understand
The Lag Effect
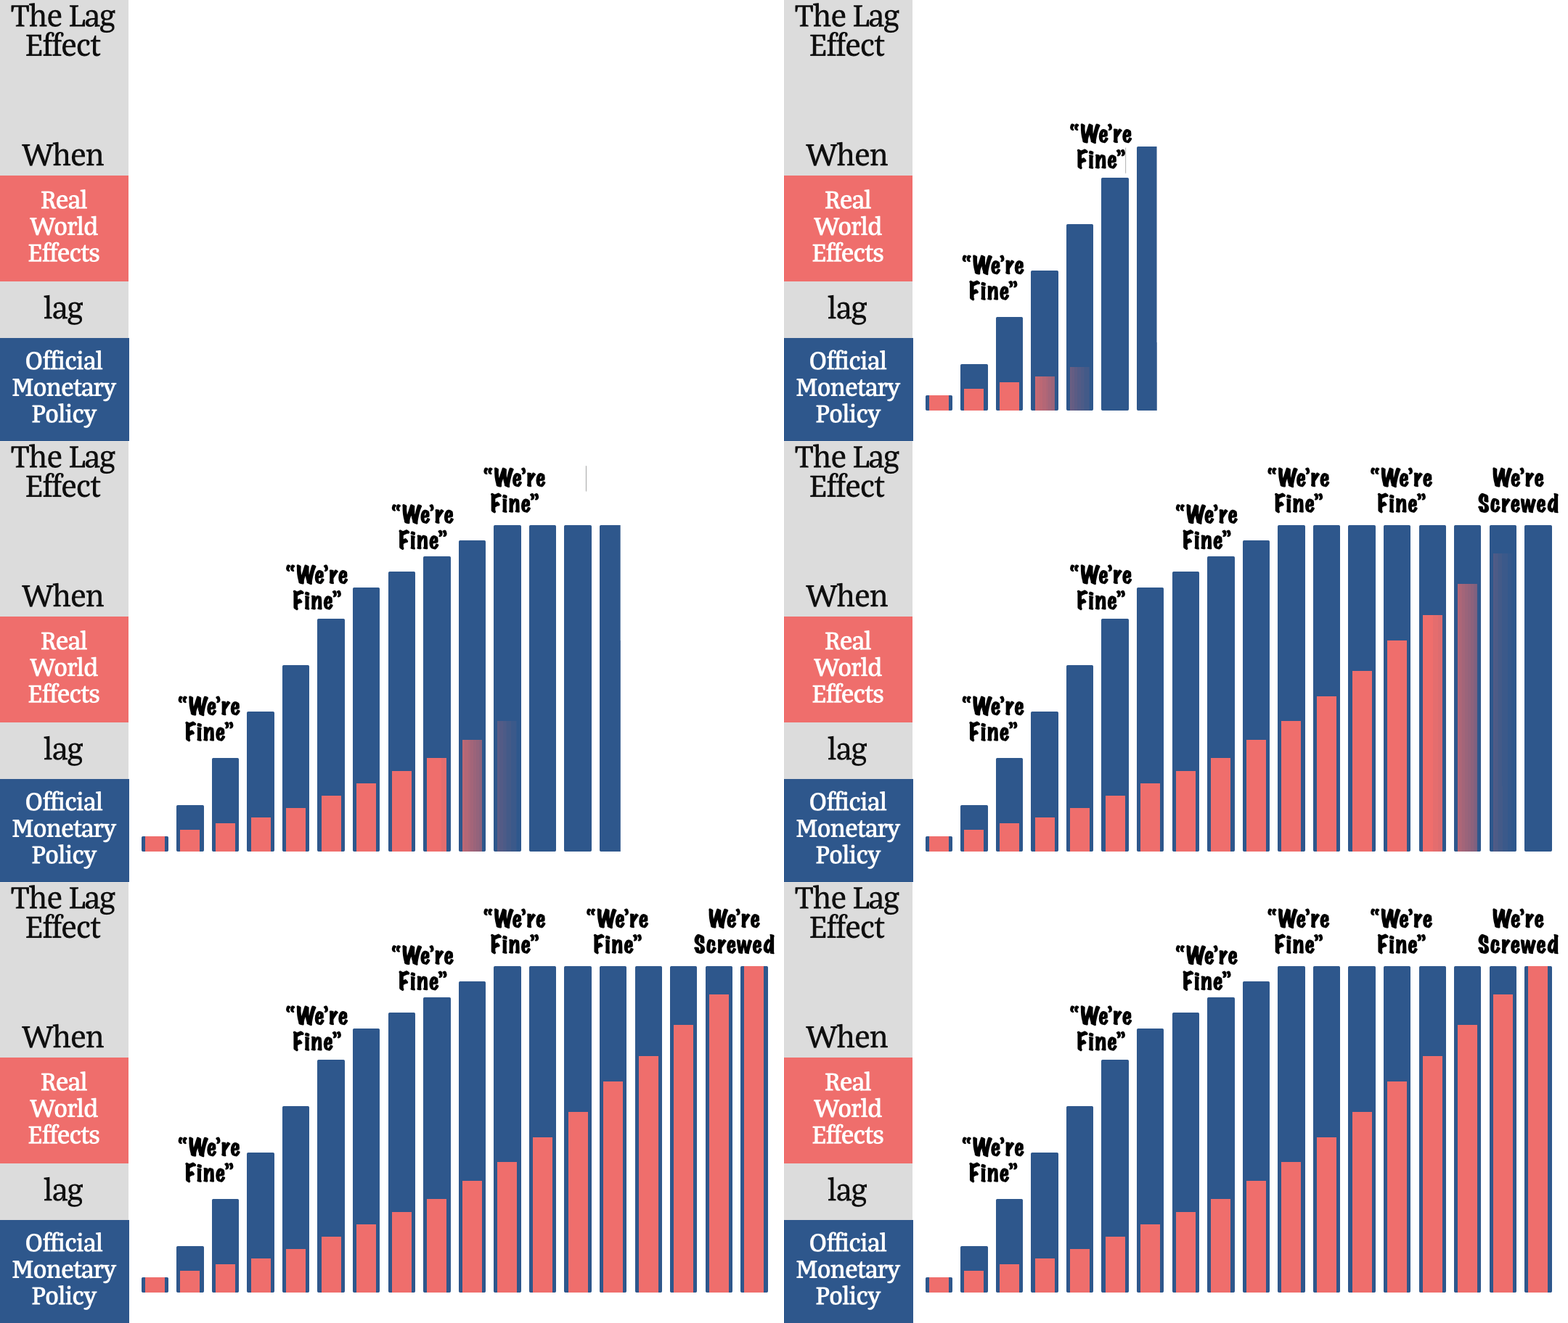
This graphic represents how real world effects (i.e. a slowing economy) often lag official monetary policy.
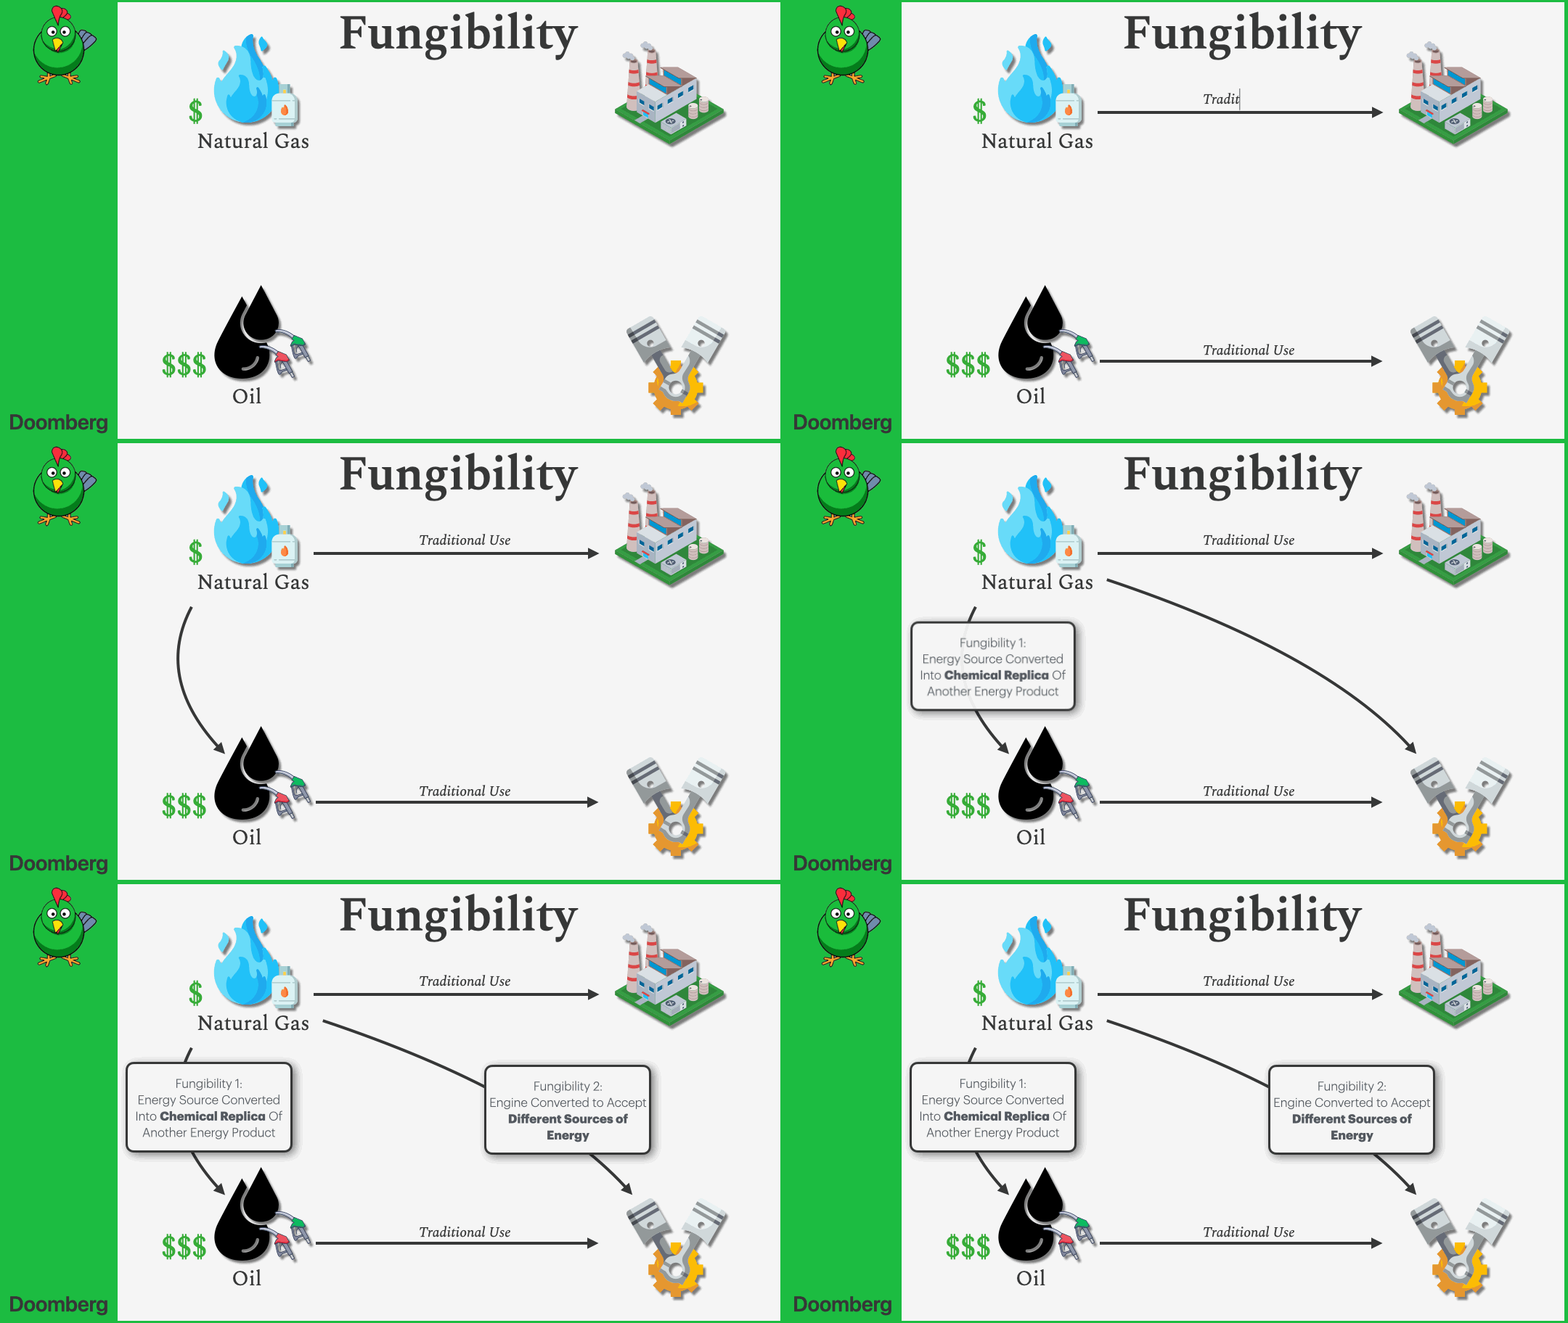
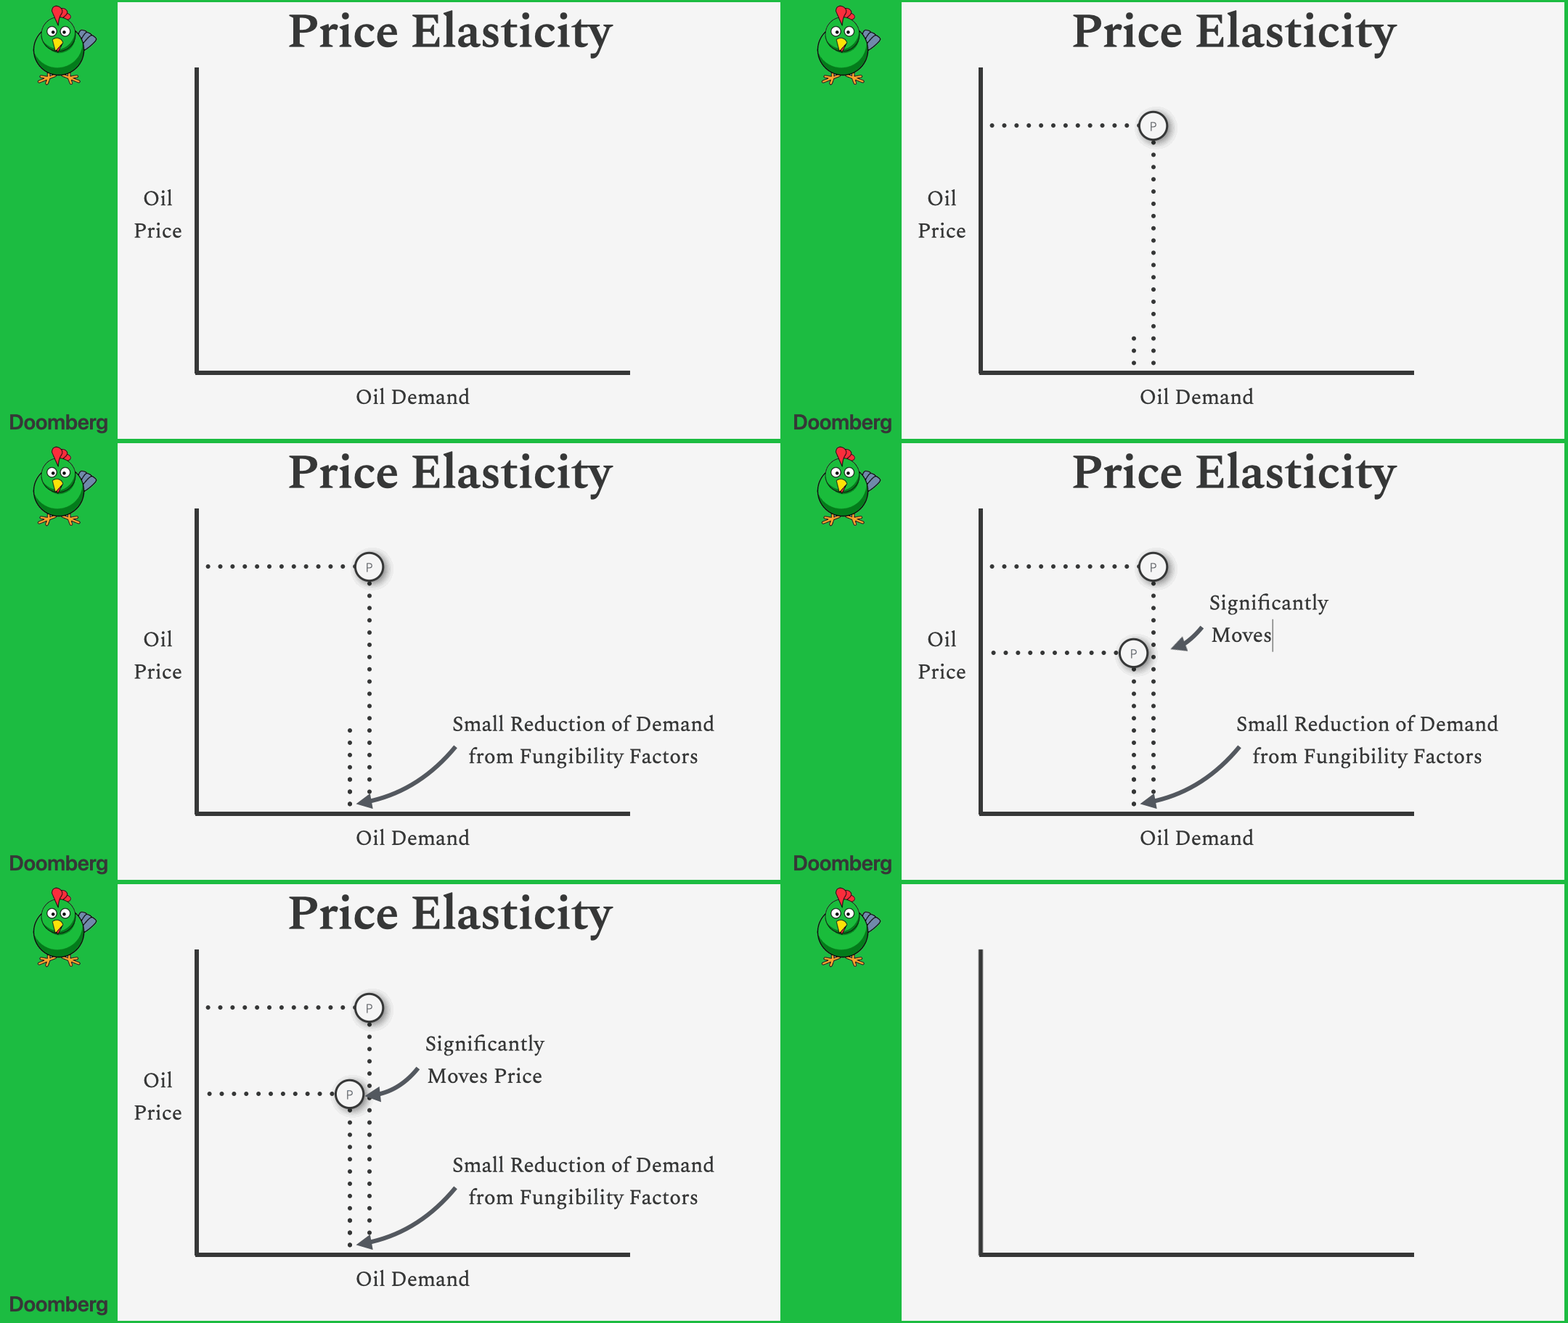
The Energy Market
From Doomberg's Piece on how the energy market works. The energy market trends towards making energy products (ex: natural gas & diesel) interchangeable with each other (fungible) which has a downward effect on price (price elasticity).
iBonds Explainer
iBonds are an investment that protects against inflation by combining the inflation rate and a fixed rate. In this video iBonds are explained via talking head & explainer graphics to illustrate some of the more complicated dynamics of the investment.
Economics Decoded
A series of "hand drawn" explainer videos focused on economics, investments and other complex topics.
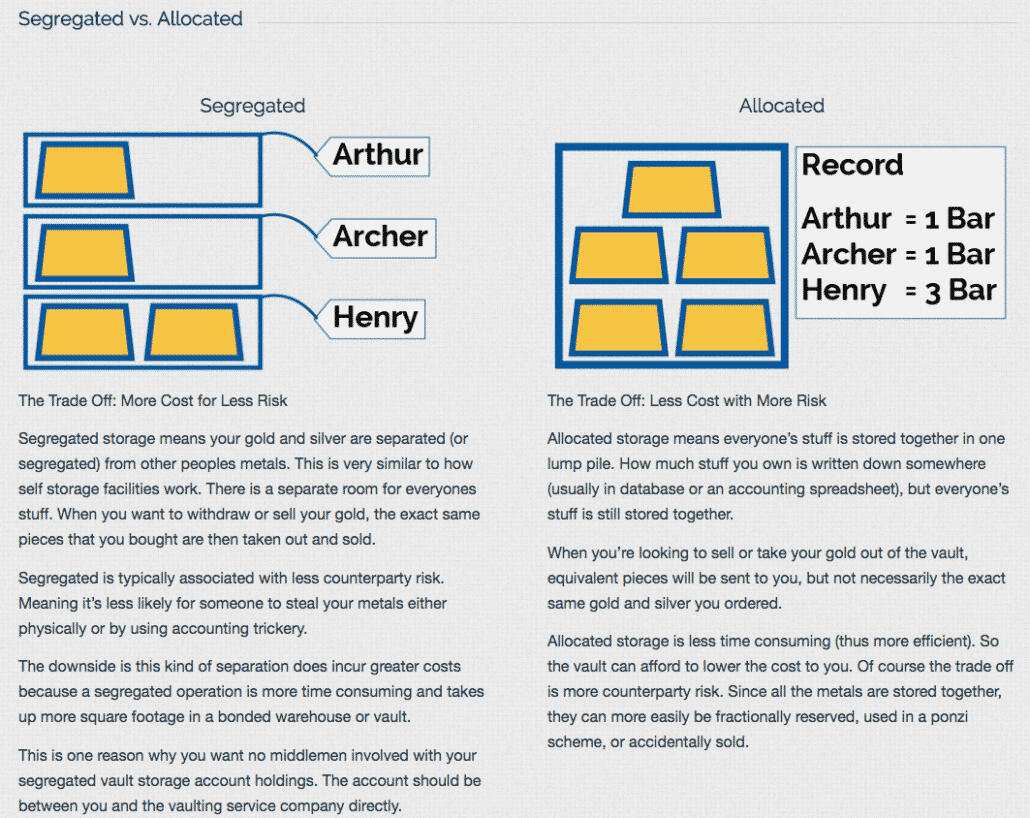
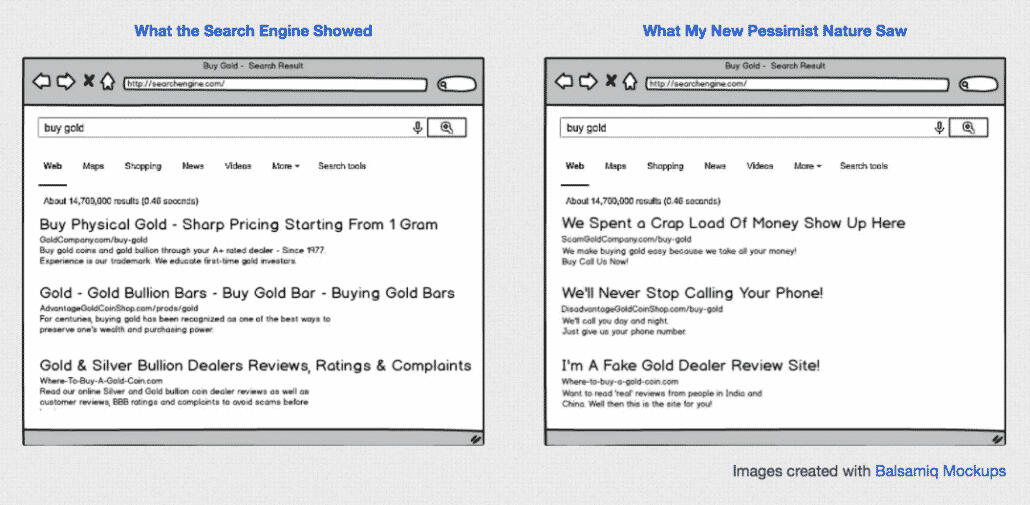
Lucid Gold
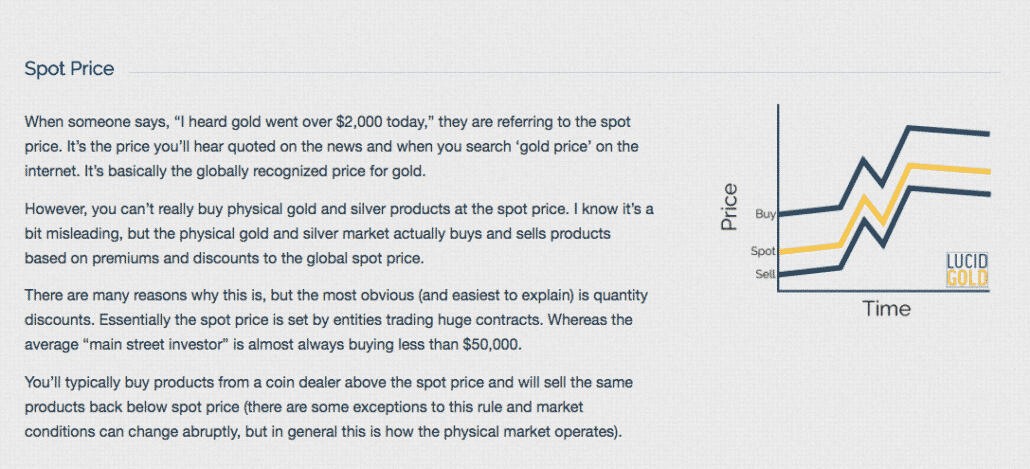
Website based on explaining the in's and outs of physical gold and silver investing and related questions (buying, selling, storing, etc.).

Debt Collapse
Presentation created with Mike Maloney's Team (author of best selling book "Guide to Investing in Gold & Silver") to explain the current (2012) monetary situation. Heavy use of graphs as story telling tools to explain Mike's investment thesis.
Get In Contact
Need help making your complicated financial topic easy to understand? Send us a message on what you're looking for assistance with.

